There are wild estimates about how much "illegal" gambling is done when Super Bowl Sunday comes around each year. There are reports of anywhere from hundreds of millions to billions of dollars wagered outside of Las Vegas.
The general rule used by the experts is that illegal gambling totals 40x the amount of legal gambling on major sporting events.
That would mean a Vegas reported handle of $100 million would equate to $4 billion wagered illegally. Take that for what you will, there's not really any evidence to support it, but it makes a good headline.
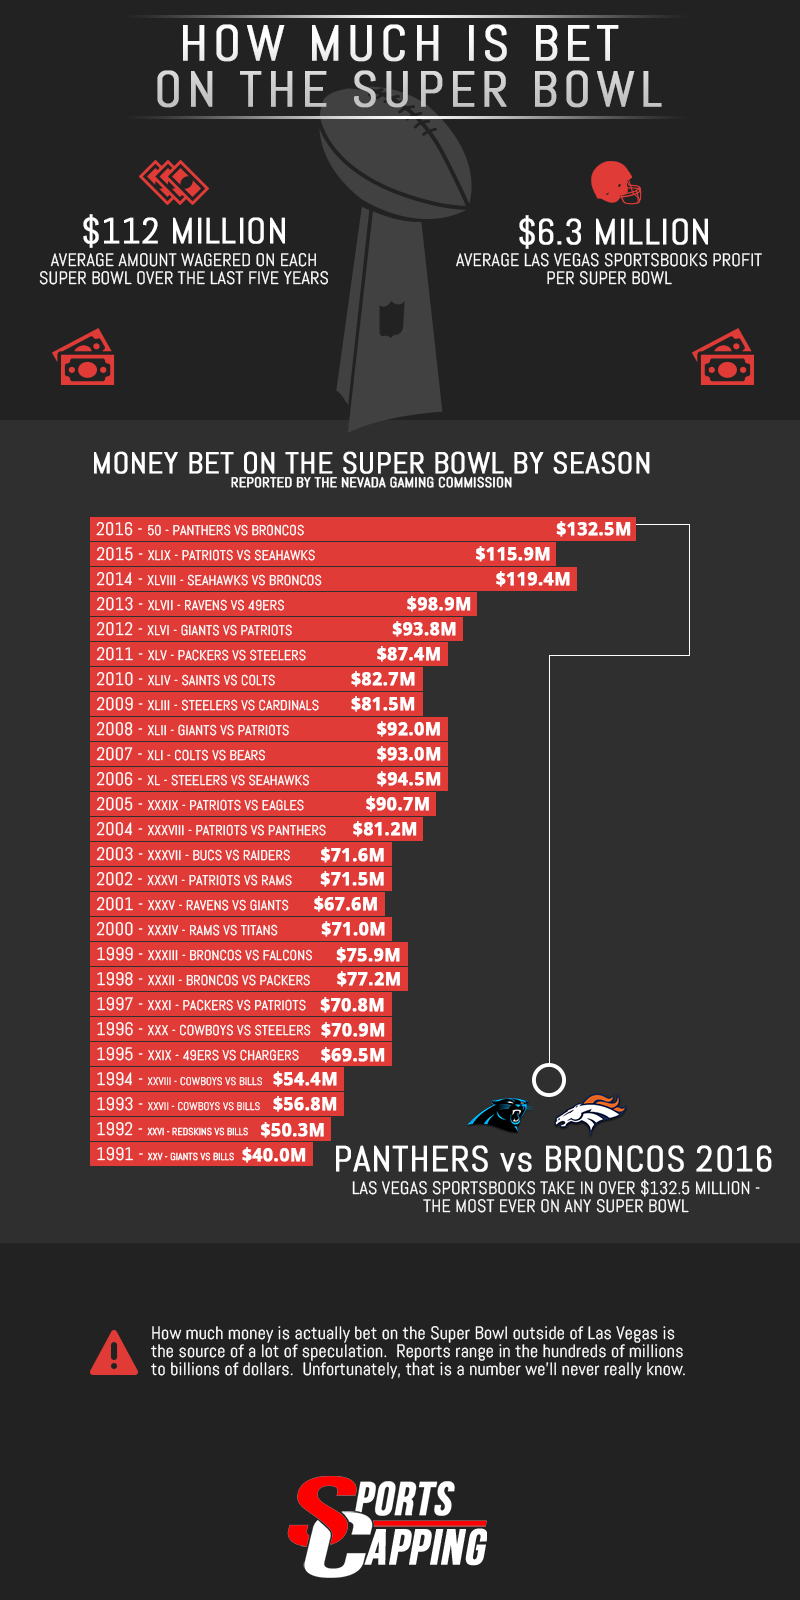
What we do know is how much Las Vegas sportsbooks take in and profit each season on the game and have that information listed in the table below. Take a look at our handy infographic below for a visualization of the numbers.
The handle is simply how much money gets bet on the game, while the hold is the percentage of winnings (or losses) the books have taken on each game.
Handles & Holds
| Season | Super Bowl | Handle | Profit/Loss | Hold | Matchup |
|---|---|---|---|---|---|
| 2016 | 50 | $132,545,587 | $13,314,539 | 10.1% | Broncos v. Panthers |
| 2015 | XLIX | $115,986,086 | $3,261,066 | 2.80% | Patriots v. Seahawks |
| 2014 | XLVIII | $119,400,000 | $19,700,000 | 16.50% | Seahawks v. Broncos |
| 2013 | XLVII | $98,936,798 | $7,206,460 | 7.30% | Ravens v. 49ers |
| 2012 | XLVI | $93,899,840 | $5,064,470 | 5.40% | Giants v. Patriots |
| 2011 | XLV | $87,491,098 | $724,176 | 0.83% | Packers v. Steelers |
| 2010 | XLIV | $82,726,367 | $6,857,101 | 8.29% | Saints v. Colts |
| 2009 | XLIII | $81,514,748 | $6,678,044 | 8.19% | Steelers v. Cardinals |
| 2008 | XLII | $92,055,833 | -$2,573,103 | -2.80% | Giants v. Patriots |
| 2007 | XLI | $93,067,358 | $12,930,175 | 13.89% | Colts v. Bears |
| 2006 | XL | $94,534,372 | $8,828,431 | 9.34% | Steelers v. Seahawks |
| 2005 | XXXIX | $90,759,236 | $15,430,138 | 17.00% | Patriots v. Eagles |
| 2004 | XXXVIII | $81,242,191 | $12,440,698 | 15.31% | Patriots v. Panthers |
| 2003 | XXXVII | $71,693,032 | $5,264,963 | 7.34% | Bucs v. Raiders |
| 2002 | XXXVI | $71,513,304 | $2,331,607 | 3.26% | Patriots v. Rams |
| 2001 | XXXV | $67,661,425 | $11,002,636 | 16.26% | Ravens v. Giants |
| 2000 | XXXIV | $71,046,751 | $4,237,978 | 5.97% | Rams v. Titans |
| 1999 | XXXIII | $75,986,520 | $2,906,601 | 3.83% | Broncos v. Falcons |
| 1998 | XXXII | $77,253,246 | $472,033 | 0.61% | Broncos v. Packers |
| 1997 | XXXI | $70,853,211 | $2,265,701 | 3.20% | Packers v. Patriots |
| 1996 | XXX | $70,907,801 | $7,126,145 | 10.05% | Cowboys v. Steelers |
| 1995 | XXIX | $69,591,818 | -$396,674 | -0.57% | 49ers v. Chargers |
| 1994 | XXVIII | $54,483,221 | $7,481,541 | 13.73% | Cowboys v. Bills |
| 1993 | XXVII | $56,811,405 | $7,174,869 | 12.63% | Cowboys v. Bills |
| 1992 | XXVI | $50,334,277 | $301,280 | 0.60% | Redskins v. Bills |
| 1991 | XXV | $40,080,409 | $3,512,241 | 8.76% | Giants v. Bills |
Infographic

It's no surprise that the numbers are this high. It's the most popular day in the books all year. You will see large crowds show up during March Madness, but that is an event that lasts a couple of weeks.
What you won't see is another game that has as many different types to wager. This year alone there were over 500 wagering options on anything and everything to do with the entertainment, players, coaches, and celebrations.
There isn't an event in today's age that trumps the Super Bowl so why wouldn't the amount of action on the game be any different.
